| Product | ProductSeq | Product Category |
|---|---|---|
| Standard 200 ml | 1 | Bertolli |
| Standard 500 ml | 2 | Bertolli |
| Standard 200 ml | 3 | Carapelli |
| Standard 500 ml | 4 | Carapelli |
| Standard 750 ml | 5 | Carapelli |
| Standard 200 ml | 6 | Figaro |
| Standard 200 ml | 7 | Friol |
| Standard 500 ml | 8 | Friol |
| Standard 750 ml | 9 | Friol |
Sample data
Art: Time travel is not a fantasy anymore, atleast in Indian entertainment scene
The very concept of space-time is freaking mind numbing, the fact that the 3 dimensions of space and the 4th dimension of time are not really disjointed, but are absolutely stitched together, is something which is hard for us to wrap our heads around. For simplicity’s sake, think about it this way, where are you? If I ask this innocuous question, you will probably give me your longitude and latitude position. Which is like X and Y dimensions of space. In case you are living in an apartment complex, you might give me a third dimension, Y, the height, like 8th floor. Now these 3 dimensions of space should be enough for me to know where you are, but then there is an implicit 4th dimension you have given me, that is of time. Which means this is where you are RIGHT NOW. Maybe you weren’t there an hour ago, maybe you won’t still be there 30 minutes from now, which means that to know your exact position, I need at least 4 dimensions, X, Y, Z, and t. Any dimension missing, and I won’t reach you, I won’t know where you are.
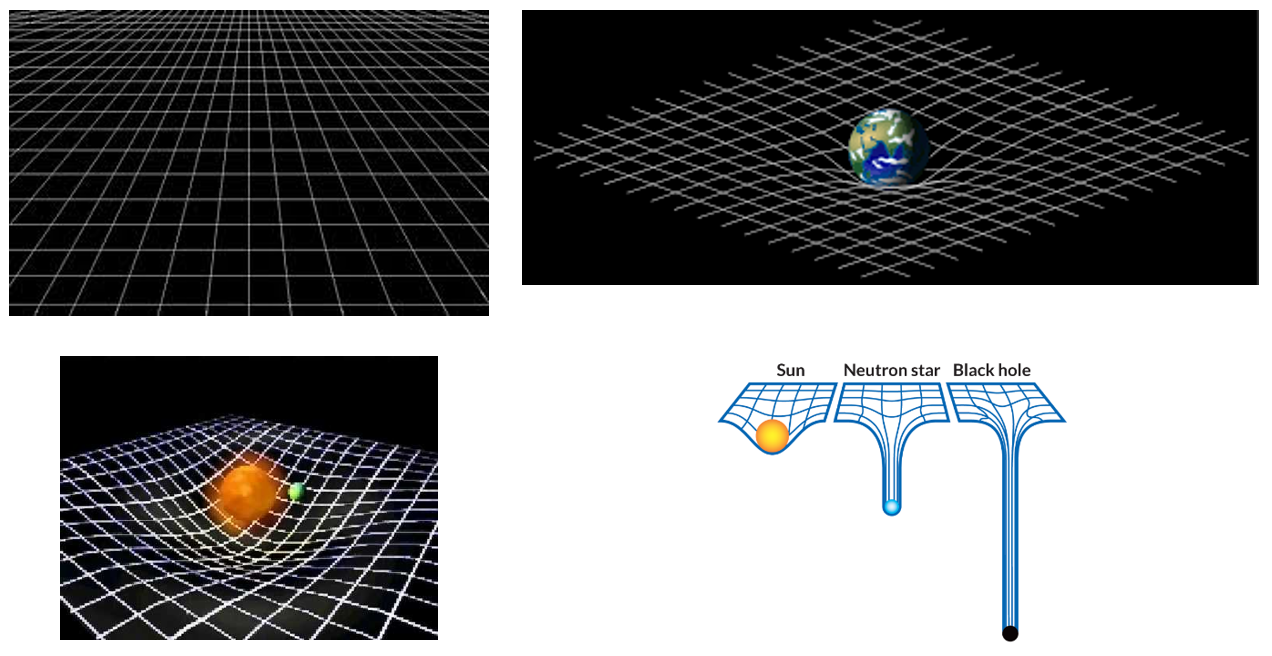
Space Time Fabric
Welcome to the world of analytics
In last 10 years we collected wealth of experience while partnering with some of the biggest organizations of the world in disparate industries and geographies. This blog is an attempt from our side to pass on our learnings and knowledge to those who want to learn various forms, tools and challenges that we come across in the field of analytics.
Though we will discuss analytics at large, but our prime focus is going to be on the digital platforms for some of the reasons listed below:
- There are 450 million + internet users in India (2nd highest after China)
- In last 1 year, our internet population has grown by more than 30%, whereas our total population has grown by 1.2% (need less to say that it's highest across the globe)
- We still have only little less than 35% of population using internet.
- With advent of Reliance Jio in the market, we probably can't even fathom today, how it would disrupt the traditional markets, our assumptions and consumer behavior.
When the world around us is changing at such high velocity, we need to traverse the path ever so carefully so that we don't fall behind, or even risk a lot while trying to keep up with the pace. The content of this blog has been designed to effectively:
- Teach the nuances of analytics with laser focus on digital space
- Provide superior level of knowledge, best industry practices and benchmarks
- Improve your efficiency by talking about hacks and cheat codes of the world of analytics
We all at this academy hope that you would enjoy your stay here, and will like our content. In case of any issue, concern or question, please do feel free to reach to us through Contact Page.
Art: Profoundness of this universe
I had always been intrigued by the sheer gargantuaness (I know that there's no word like that) of the sky above. Mind you, visible sky, visible to our naked eyes. Then something remarkable happened, I started studying these things in school, and of course as you might have experienced as well, everything became an equation, a classwork and homework assignment where I lost my zeal, interest and inquisitiveness to ask some of the most fundamental questions. And I give you a very small example, like charges repel each other, unlike charges attract each other, how come all all protons live happily inside the nucleus? How does weather change? Why do we have summers and winters, and let me give you a clue, it's not because our planet goes closer to sun hence summers (perihelion), farther from sun, hence winters (apehelion)?


Art: Correlation, Causation and More
So, after much chagrin from me you have finally become data analysts, you have finally started looking into your data, and started trusting your data. And the day you decide to do all this, you notice something creepy. You start looking into all those movies that Nicholas Cage starred in and started seeing if that mean something. Lo and behold, you come out with following chart:


Art: Data driven optimization through mobile analytics

Mobile is driving the big transformation in today's world, across industries. This transformation is in the way organizations do business, the way consumers avail products and services and the way marketeers present their offers. Just to give you an idea of the importance of mobile:
- 80% people don't leave home without their mobile devices
- In India, 72% of all website data actually comes from smart phones
- Internet contributed 5% of GDP growth in India
- In March 2015, for the first time ever in US, Comscore registered more people accessing internet through mobile only. The trend is only increasing
Art: Digital Analytics for non-Ecommerce organizations

Many times we confuse ourselves thinking that when we talk about conversion rates in digital analytics, or web analytics, we are talking about ecommerce businesses where one party is buying other is selling, and hence digital marketing tools like Adobe Analytics and Google Analytics are not relevant to non-ecommerce businesses like banks, media houses, or even the entire B2B segment. But nothing can be farther than truth.
Art: A bit more about Views
We covered the basics of views while discussing Hierarchies within GA here. Now let's take a better look at Views because that's where an analyst spends most of his/her time. This is the level where you get your dashboards, reports and all other analysis tools.
The default view is created as soon as you create your property. In case you have just created your account, both, default property and default view, are automatically created for you. Let's understand why do we need these views in the first place.
Art: More information about Visitor/User cookie
We need to understand who are the visitors of our digital platforms. We utilize cookies as discussed here to identify return and new visitors to the specific digital platforms.

Visitor ID cookie within GA is first party cookie, which enables webanalytics tool (GA or Adobe Analytics) to track the visitor behavior in a much better way, even on systems where third party cookies are blocked.
Art: Cookies of GA
Google Analytics installs 5 different cookies when you visit a website/digital property which has GA implemented. We are going to talk about one of the most important cookie out of those, the visitor ID cookie.
As we discussed in earlier posts, Google Analytics uses cookies to identify visitors and visits. If you want to refresh about visitors and visits, please refer to the link here.

As we discussed in earlier posts, Google Analytics uses cookies to identify visitors and visits. If you want to refresh about visitors and visits, please refer to the link here.
Art: Creating segments within Google Analytics
I would recommend you to read theory of segmentation here, before you read about how to create segmentation within GA. Once you have understood the importance of segmentation and use of it then it would make much more sense about how to create, and implement segmentation within GA.

Once you login to you account, and look into reports, at the top side of the page you would be able to see something closer to the image above. It shows you two blocks, All Sessions and Add a Segment. All sessions means that all the sessions that have been recorded on your digital platform has been included into the analysis within your reports,
Art: Theory of Segmentation
If you have spent some time in marketing classes within your MBA, or involved with marketing/campaign team in your past experience then you would be knowing this, every marketing effort starts with one step called as Segmentation. STP (Segmentation, Targeting and Positioning) is something that we have all gone through. In this article I am going to talk a little bit about Segmentation and then in next post we will see how segmentation as a functionality is utilized with GA.

In classical sense segmentation is of 4 kinds:
1) Geographic
2) Demographic
3) Behavioral
4) Psychographic
In classical sense segmentation is of 4 kinds:
1) Geographic
2) Demographic
3) Behavioral
4) Psychographic
Art: Creating and implementing Custom Dimensions
If this is the first time that you are reading anything about custom dimensions, I would recommend you all to read the earlier article which explains a bit about custom dimensions and metrics by clicking on the link

Now that you have a basic idea about what custom dimensions are, and why do we need them in the first place, let's talk about how to create them. Like all other implementation tips, this one also starts by logging into your GA account. Now go to Admin section and look within the property hierarchy (Information about GA Hierarchies) and find custom definitions.
Now that you have a basic idea about what custom dimensions are, and why do we need them in the first place, let's talk about how to create them. Like all other implementation tips, this one also starts by logging into your GA account. Now go to Admin section and look within the property hierarchy (Information about GA Hierarchies) and find custom definitions.
Art: What is Cohort Analysis?

Have you ever been compared with someone else? If you are from a country like India, then answer has to be yes. More often than not it's our parents who say something like, look at your elder cousin Ashutosh, how he has made a career of himself, you are on internet god knows doing what? Or may be your teachers saying, my students of batch 2000 were so much better, look at them where they are now, how successful they are. But my question is more rudimentary, can you compare two distinct groups of two different eras, timelines and find out which has been more effective or beneficial?
Art: Google Analytics Reporting 2: Aquisition Reports

Art: Reading Reports the right way

So, what you see in your data? Is your objectivity hindered by your personal situation, bias, or simply because you are having difficult time looking at the complete picture? Of course no, there's no way that you are not object, what am I even talking about.
Now that we have established our objectivity, let's quickly do this, rank the campaigns according to their effectiveness:

Art: New Beginning: Let's Re-Start

I had been out of this blog for so long now that I was contemplating to close it altogether. But then it was like an epiphany when I thought why I started this thing in the first place. The reason was never to make it number 1 blog all across, but to practically implement my knowledge, and helping others to understand about the domain. So, I decided to revamp my efforts and let's re-start.
Art: Information about Custom Dimensions and Metrics
Once you have implemented Google Analytics on your website, you start getting the reports in your tool. But at this time you realize that may be you want some more data, for example, what kind of error messages people come across on your site? Which users come on your site? How many newsletter sign up have occurred in last 7 days on your site? For such instances we can use customization within the GA code to create custom dimensions, and capture such additional parameters during the journey of our online visitors.
Art: Google Analytics Reporting 1: Real Time and Audience Reports
Welcome to your first reporting session. Now that we have figured out how we need to place the GA code, where do we need to place the code, let's talk about reporting, the very reason we took up the challenge to implement GA in the first place.
In this post we will talk about 2 major groups of reporting, Real Time and Audience Reports.
In this post we will talk about 2 major groups of reporting, Real Time and Audience Reports.
Subscribe to:
Posts (Atom)